Ford sees an opportunity to provide a more holistic view of what is happening on city streets with the most up-to-date information available via connected vehicle event data. Using Ford’s Safety Insights platform, in collaboration with StreetLight Data, the company’s goal is to help to proactively arm cities with the up-to-date, rich information they need to make more informed — and more timely — decisions about their safety infrastructure.
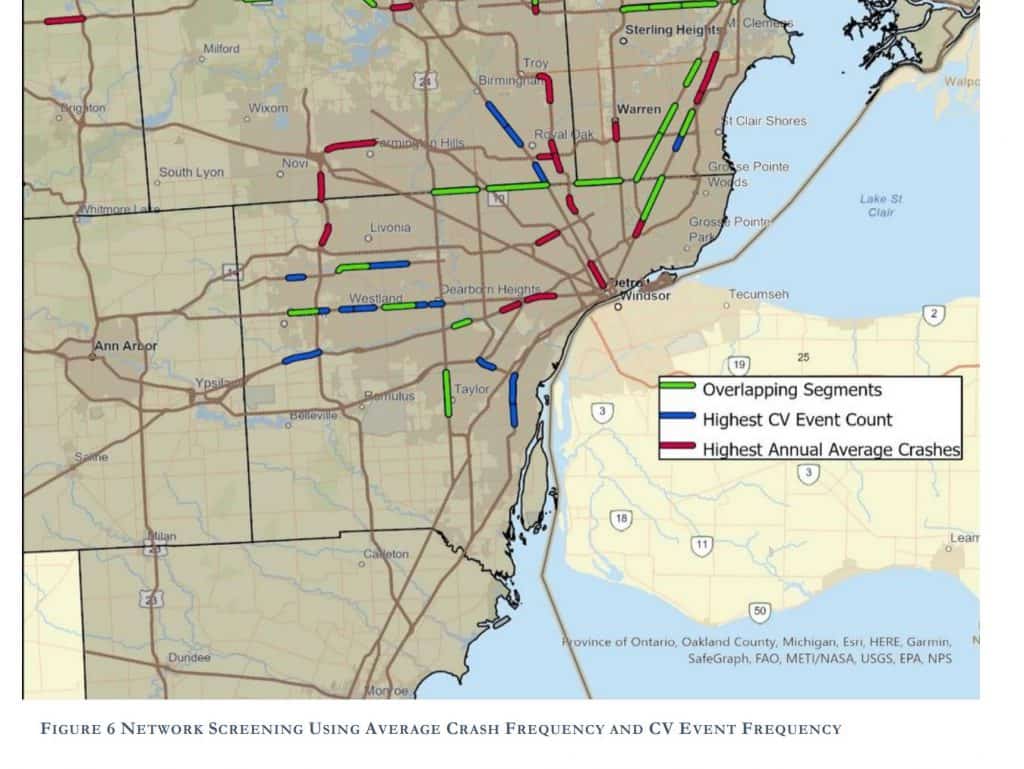
Since late 2020, Ford has been working with Michigan State University (MSU) on an ongoing research project to analyze existing connected vehicle event data, which captures insights around harsh acceleration, harsh braking, and harsh turns, against crash data from 2015–2019 in Southeast Michigan. Connected vehicle event data has significant promise because it can be obtained both at a larger scale and in a timelier manner than crash-reported data.
Putting the data to the test with Michigan State University: Since late 2020, Ford has been working with Michigan State University (MSU) on an ongoing research project to analyze existing connected vehicle event data, which captures insights around harsh acceleration, harsh braking, and harsh turns, against crash data from 2015–2019 in Southeast Michigan. Connected vehicle event data has significant promise because it can be obtained both at a larger scale and in a timelier manner than crash-reported data. For example, within the Safety Insights tool, connected vehicle data is currently updated daily. Ford and MSU wanted to understand how connected vehicle events relate to crash data patterns and safety trends and most importantly, if this can help cities decide where to invest their transportation safety dollars.
Connected Crash Patterns
The teams from Ford and MSU found a statistically significant, strong positive correlation between harsh connected vehicle events and reported crash patterns, which when combined, can provide a more informed understanding of unsafe traffic patterns. This robust relationship indicates that the connected vehicle event data could even be used as a leading indicator or surrogate for crash data in cases where cities want to stay on top of emerging trends on their road network. For example, when overlayed using Safety Insights, city planners will have a more complete picture of what is actually happening on city streets. This means that cities can also be proactive. For example, if a city is currently using 2020 crash data, they can use 2021 connected vehicle data to understand if an infrastructure change at an identified crash hotspot appears to be improving conditions at that location (e.g., by seeing a reduction in harsh braking).
Crash data can be noisy and subjective: With crash data, city planners are reliant on the incident being reported via a police report, if it is reported at all. It also could be cited with a bias; think of a two-vehicle collision when drivers offer conflicting reports of what occurred. There is also the factor of randomness involved with crashes. For instance, something as basic as a random fallen tree branch or simple human error could have led to an incident. As a result, it takes time to start to see hotspots where there are truly significant infrastructure issues, and it can take years of data to spot real trends and substantiate them.
Connected Vehicle data offers a more objective picture: A harsh braking event is always a harsh braking event. Connected vehicle data captures events every time using the same systems and thresholds there is no human observation required to log and report the event. You can also see trends much quicker over time as a result of the volume of connected vehicle event data. While harsh braking may not always result in a crash, it could indicate a future hotspot if a pattern emerges. With access to the most up-to-date data, this allows cities to better predict and identify emerging safety hotspots, even before significant crash activity occurs.
These rich, up-to-date insights can help cities maximize their budget: The most up-to-date data allows cities to move more efficiently when identifying and responding to potentially problematic areas. Faster analytics and ready-to-use data and software means fewer hours identifying hotspots and more accurate, up-to-date data means a higher probability of identifying and introducing the right solution at the right place the first time.
COVID-19 impact on data: As result of COVID-19, traffic patterns have become even more dynamic. People aren’t commuting into work every day, or perhaps they are taking other forms of mobility like e-scooters. Connected vehicle event data offers cities a way to gather new, relevant information to better identify changing travel patterns during unprecedented times. This ensures that cities are addressing today’s transportation patterns, not those based on old data or out-of-date plans.
The bottom line: At a minimum, Ford and MSU researchers found that connected vehicle event data can be a strong compliment to the existing crash report data, serving as a second source to confirm previous findings or intuitions. The results of this research also point to the prospect of connected vehicle event data being able to inform up to date decision making to potentially help cities save time, money and most importantly, act on hotspots sooner to potentially save lives on the roads.
Read the full Whitepaper titled Connected Vehicle Data Validation: How Do CV Events Relate to Collison Trends?