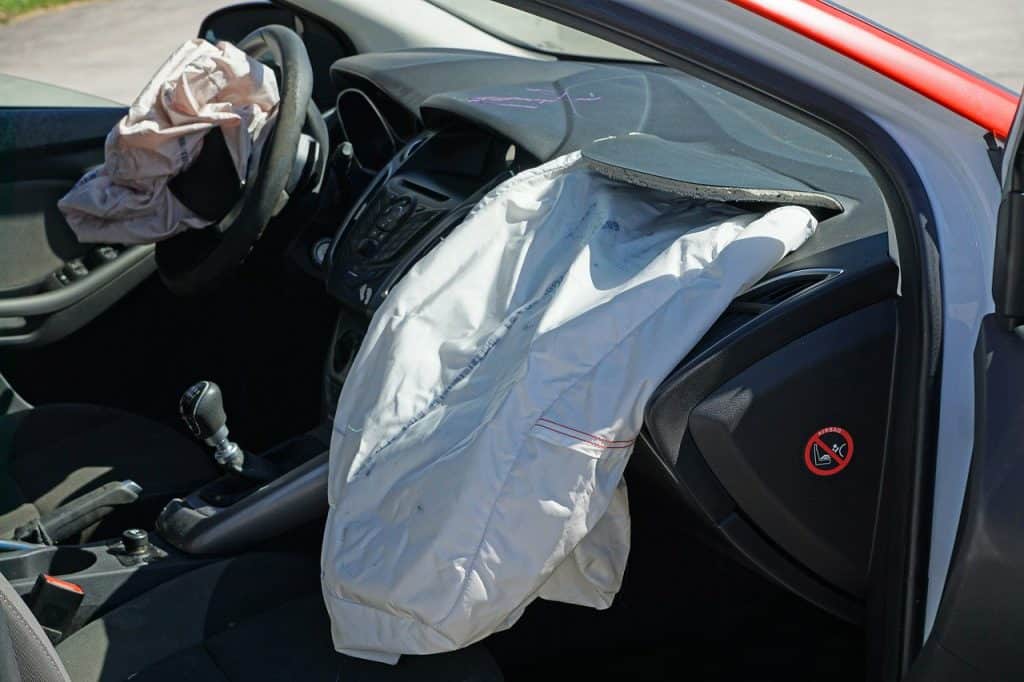
According to NSC estimates, the 20% increase in the death rate is the highest jump NSC has calculated for a six-month period since 1999.
In June – when many states ended three straight months of quarantine – the number of miles driven remained 13% lower than the previous year, but death rates and number of deaths both skyrocketed. The number of deaths was up 17% in June, while the rate of death per 100 million miles driven jumped a staggering 34.4% – again indicating that the lack of traffic did not make the roads safer. June marked the first month since the pandemic that both the number of fatalities and the death rate increased in a single month.
The riskier roads threaten to reverse traffic safety gains made over the last few years. After three straight years of rising fatality numbers between 2015 and 2017, the country had been experiencing a leveling off and small decline in overall fatalities.
“Because of COVID-19 and states’ shelter-in-place orders earlier this year, the country should have reaped a safety benefit from less traffic,” said Lorraine M. Martin, president and CEO of the National Safety Council. “Instead, our soaring rate of deaths speaks to our need to improve safety on our roads. Clearly, we must work harder as a society to reverse this trend, especially since the pandemic is not nearly over.”
Through the first six months of 2020, the following seven states experienced notable decreases in the number of roadway deaths:
- Wyoming (-49%, 39 fewer deaths)
- Alaska (-31%, 11 fewer deaths)
- Hawaii (-27%, 16 fewer deaths)
- Iowa (-24%, 35 fewer deaths)
- North Dakota (-20%, 9 fewer deaths)
- Oregon (-19%, 41 fewer deaths)
- Idaho (-16%, 15 fewer deaths)
Seven states with notable increases were:
- Vermont (+91%, 10 more deaths)
- Connecticut (+44%, 45 more deaths)
- District of Columbia (+42%, 5 more deaths)
- South Dakota (+34%, 11 more deaths)
- Rhode Island (+31%, 8 more deaths)
- Arkansas (+21%, 51 more deaths)
- Missouri (+18%, 68 more deaths)
During this United for Infrastructure week, NSC is committed to working with partners to #RebuildBetter to improve roadway safety. To help further ensure the safety of U.S. roads, NSC urges motorists to:
- Obey speed limits, even if roads are clear and traffic is light
- Practice defensive driving. Buckle up, designate a sober driver or arrange alternative transportation, get plenty of sleep to avoid fatigue, and drive attentively, avoiding distractions.
- Stay engaged with teen drivers’ habits and practice with them frequently – tips are available at DriveitHOME.org
- Follow state and local directives and stay off the roads if officials have directed you do to so
- Be aware of increased pedestrian and bicycle traffic, particularly in urban areas. Conversely, pedestrians and bicyclists should be careful as streets become congested again.
- Organizations and employers are encouraged to join the Road to Zero Coalition, a 1,500-member group committed to eliminating roadway deaths by 2050
The National Safety Council estimates are subject to slight increases and decreases as the data mature. NSC collects fatality data every month from all 50 states and the District of Columbia and uses data from the National Center for Health Statistics, so that deaths occurring within one year of the crash and on both public and private roadways – such as parking lots and driveways – are included in the estimates. NSC motor vehicle fatality estimates and supplemental estimate information, including estimates for each state, can be found here.