 If you want to see the future of your cars or how much you will pay for repairs, it’s helpful to look at CarMD reports. There is vehicle health index as well as brand/model index. These reports can provide insight into what cars to buy in the future as well as what kind of repair bills you can expect with an aging vehicle. CarMD data shows that certian models that are generally preceived as reilable are such as the Honda CR-V and Toyota Tundra/Camry/Corolla/Prius.
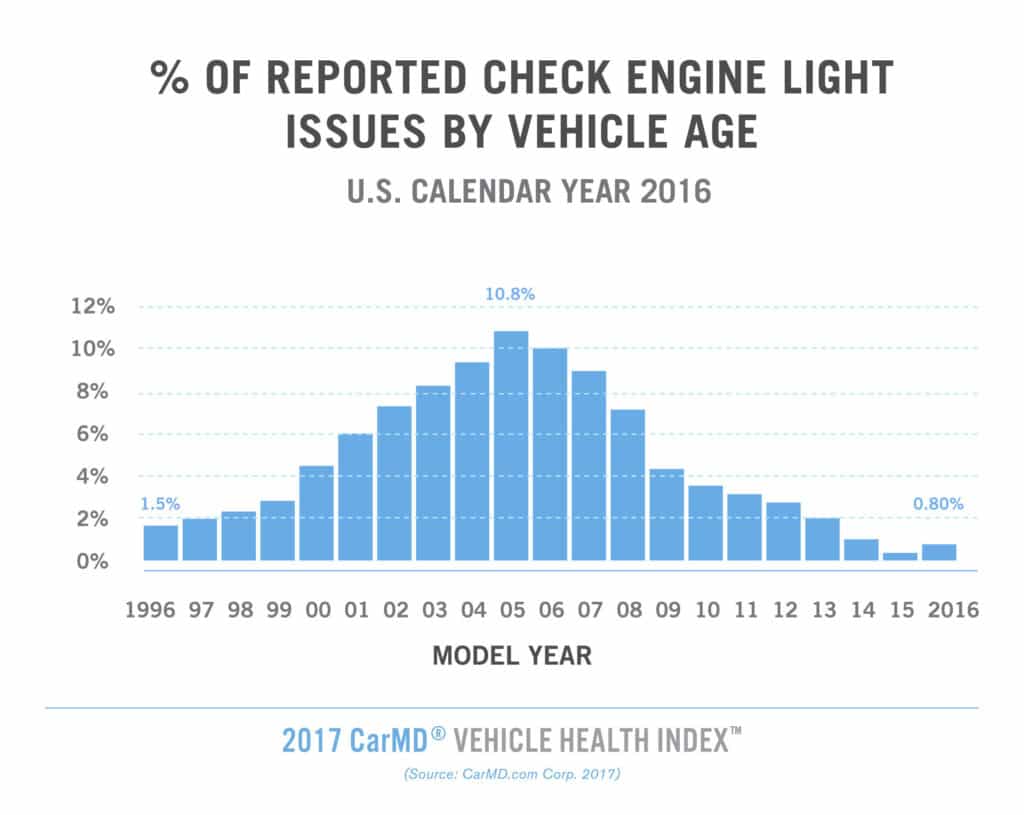
The health index tracks check engine-related car repairs, costs and trends on 5.3 million 96-2016 vehicles, driven in 2016. Most cars now are close to 12-years old. The most repairs from CarMD are found on cars from 2005 making them around 11-years old when the data is collectied. We can ascertain from the data that at that 11-12 year old stage car owners are deciding whether or not to buy a newer car or fix their old vehicle. If your car is around 10-12 year’s old it is good time to take in for maintenece. Problems that are not properly maintianed create worse problems later on.
The report found:
- A faulty oxygen sensor, which negatively impacts fuel economy if ignored, remains the most common reason drivers experience a check engine light.
- Newer model 2015 and 2016 cars and trucks each accounted for less than 1 percent of reported check engine incidents.
- The average cost to repair a check engine problem in the U.S. in 2016 was $398 including parts and labor, which is up 2.7 percent year-over-year.
The following are the five most common check engine light-related car repairs and associated average repair costs, including parts and labor. If left unrepaired, each can negatively impact gas mileage and harm the environment.
- Replace oxygen sensor – $258.
- Replace catalytic converter – $1,190.
- Replace ignition coil(s) and spark plug(s) – $401.
- Tighten or replace fuel cap – $17.
- Replace mass air flow sensor – $378.
The cost to fix the problems from $17 to replace a gas cap to $1,190 or more for a catalytic converter. This year’s Index found the only region to experience a decrease in repair costs was the West, where vehicle owners had a slight reprieve with a 1.1 percent drop in car repair costs. Drivers in the Northeast paid the most for check engine repairs ($401) while drivers in the Midwest paid the least on average ($385) for parts and labor. Car repairs and associated costs can be affected by region, maintenance decisions of previous owners, as well as the vehicle’s age.
Vehicle age affects the likelihood and type of check engine light repair incidents.
- An 11-year-old model year 2005 vehicle was most likely to report having a check engine light on, accounting for 10.8 percent of such problems reported to CarMD in 2016.
- Model year 2006 vehicles comprised 10 percent of reported check engine issues, followed by model year 2004 vehicles (9.5%) and 2007 vehicles (9%).
- Model year 2015 vehicles were least likely to experience a check engine issue, accounting for just 0.40 percent of reported problems.
- The most common causes of a check engine problem on a 2005 vehicle were faulty ignition coils and spark plugs, accounting for 7 percent of repairs and costing on average $410 to fix.
- A loose gas cap was the top reason drivers of 2015 vehicles sought help for the check engine light, accounting for 13 percent of recommended fixes and almost always covered as a warranty repair.
The type of car repairs and associated costs vary by region. The most common repair on vehicles in all four regions was “replace oxygen sensor(s)” but the parts and labor cost for this repair varied from $253 in the Midwest to $266 in the Northeast.
A new service called CarMD Garage is now available.. This helps vehicle owners stay on top of car maintenance with reports that show the maintenance services due on their vehicle. VIN decoding, warranty status, technical service bulletins, safety recalls, predicted failure data, title history, automated and accurate parts purchasing, repair cost estimates and other information is also available. CarMD Garage is designed to help consumers make informed decisions about repair, maintenance, used car and parts purchases, and to help drivers lower the overall cost of vehicle ownership.
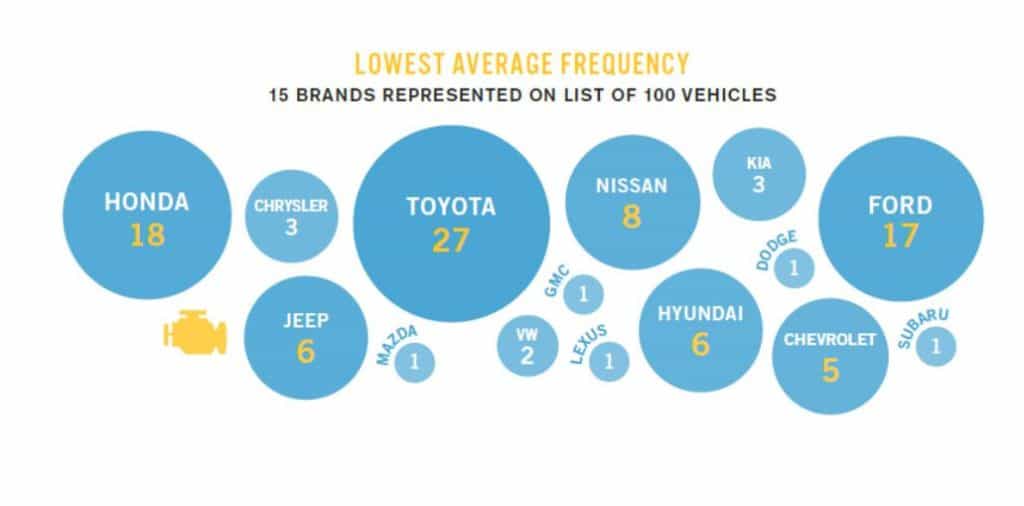
CarMD also ranks cars by frequency score:
- Toyota
- Honda
- Nissan
- Audi
- VW
- Mazda
- Mercury
- Buick
- Jeep
- Hyunda
(The Top 100 Vehicles in the U.S. (MY 1996-2016) with the fewest “check engine”-related problems)
| Rank | Year | Make | Model | Index Frequency Score |
|---|---|---|---|---|
| 1 | 2012 | HONDA | CR-V | 0.10 |
| 2 | 2014 | TOYOTA | TUNDRA | 0.10 |
| 3 | 2015 | TOYOTA | CAMRY | 0.10 |
| 4 | 2015 | TOYOTA | COROLLA | 0.10 |
| 5 | 2014 | FORD | EXPLORER | 0.10 |
| 6 | 2015 | JEEP | GRAND CHEROKEE | 0.10 |
| 7 | 2013 | HONDA | PILOT | 0.10 |
| 8 | 2015 | FORD | F250 | 0.10 |
| 9 | 2010 | TOYOTA | PRIUS | 0.10 |
| 10 | 2015 | HYUNDAI | SONATA | 0.10 |
The 2017 CarMD Vehicle Health Index analyzed 5,345,588 repairs reported to and validated by CarMD’s network from Jan. 1, 2016 to Dec. 31, 2016.
