 The National Insurance Crime Bureau (NICB) has been analyzing and reporting on vehicle theft activity for over 100 years. The looked at the theft stats to find that Halloween is a very scary for car owners because there is an increase in vehicle theft on October 31.
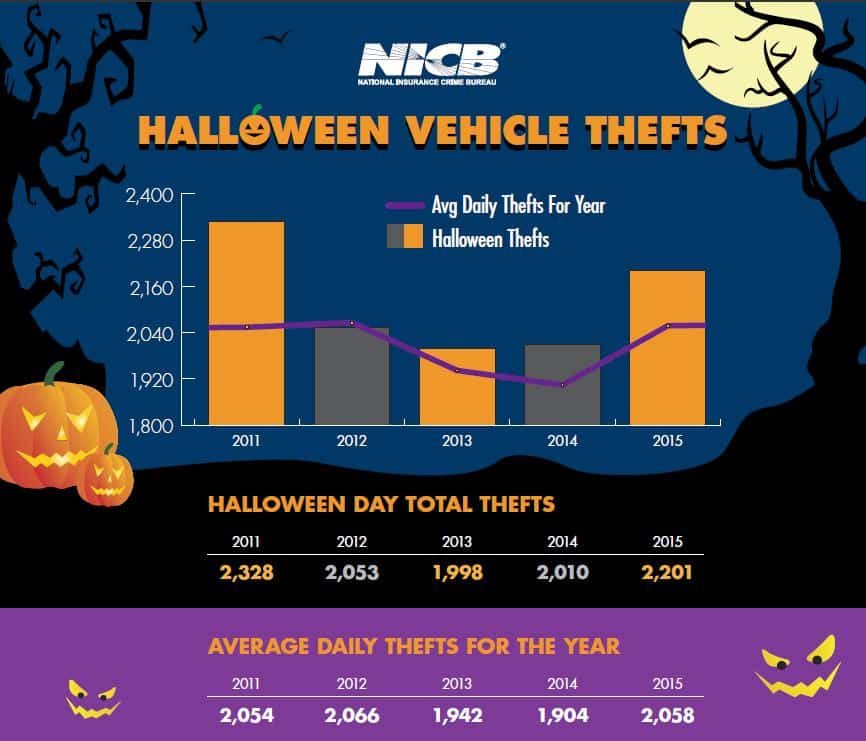
NICB examined 2011-2015 vehicle theft data contained in the National Crime Information Center’s (NCIC) Stolen Vehicle File to produce daily reported theft totals and then pulled the numbers for October 31—Halloween. The result is a straightforward presentation of theft statistics linked to Halloween, the annual celebration with roots in the Celtic festival of Samhain.
The average daily theft totals for each of the past five years was determined and then compared with the thefts reported on Halloween. Halloween thefts for four of the five years were higher than the daily average. One year, 2012, had fewer thefts.
|
2011 |
2012 |
2013 |
2014 |
2015 |
|
|
Halloween thefts |
2,328 |
2,053 |
1,998 |
2,010 |
2,201 |
|
Daily average |
2,054 |
2,066 |
1,942 |
1,904 |
2,058 |
During Halloween there may be more than ghouls, gremlins and witches canvassing the landscape. There may be car thieves will also be prowling the nation’s streets this Halloween disguised as trick-or-treaters to case neighborhoods for their next target.
So, the question remains. Is there a link between Halloween and vehicle theft? Is the behavior of vehicle thieves affected by this annual celebration? Maybe. But during the last five years the data shows more theft activity on October 31—and that’s no trick, or treat.