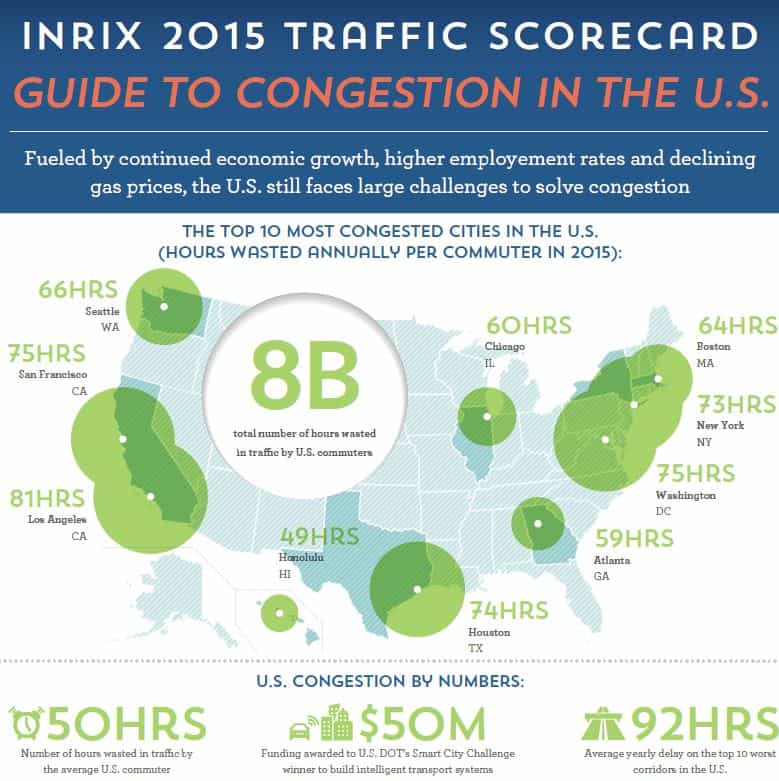
 We congratulate Los Angeles for being the most traffic congested city in the U.S. which beat out most European cities, according to INRIX’s 2015 Traffic Scorecard. INRIX monitors traffic and recently bought OpenCar.
The United States has 50 percent of the top 10 metros with the worst traffic congestion across the U.S. and Europe; only London has worse traffic than top-ranked U.S. cities with 101 hours of delay per commuter.
The top 10 cities in the U.S. with the worst traffic rank in terms of average time wasted per commuter:
- Los Angeles, CA – 81 hours.
- Washington, DC – 75 hours.
- San Francisco, CA – 75 hours.
- Houston, TX – 74 hours.
- New York, NY – 73 hours.
- Seattle, WA – 66 hours.
- Boston, MA – 64 hours.
- Chicago, IL – 60 hours.
- Atlanta, GA – 59 hours.
- Honolulu, HI – 49 hours.
The report notes the most striking common feature of the 10 metros on the most-congested list is a relatively high level of economic growth and job creation. While declining gas prices certainly contribute to congestion, the metros ranked in the 2015 Traffic Scorecard did not experience particularly significant fuel-cost reductions compared to the rest of the country. All top-10 metros except Houston saw their GDPs rise more sharply than the national average of 2.4 percent.
INRIX contends that applying big data to create intelligent transportation systems will be key to solving urban mobility. INRIX’s traffic analytics can help city planners and engineers make data-based decisions to prioritize spending where it will create the biggest impact now and for the future. When working with limited budgets to manage transportation systems, using data-based performance metrics can make a major difference in the outcomes of planning and implementing new infrastructure.
INRIX partners with more than 200 governments and agencies worldwide, providing them with mobility data and analytics to tackle transportation challenges and enhance intelligent movement.
Findings in the INRIX 2015 Traffic Scorecard are drawn from traffic speed data collected by INRIX on more than 1.3 million miles of urban streets and highways in the U.S., along with highway performance data from the Federal Highway Administration.
INRIX’s 2015 Traffic Scorecard shows that 70% of the 13 European countries analyzed saw a decrease in congestion compared to 2014. London’s congestion was due to population increases and major roadworks.